
Using comics and curiosity to drive pandemic research on a national scale
This is the ‘Accepted Manuscript’ version of: “Using comics and curiosity to drive pandemic research on a national scale” published in The Journal of Visual Communication in Medicine on 18/11/20, available online: https://doi.org/10.1080/17453054.2020.1823206
Authors: Ciléin Kearns, Nethmi Kearns, Irene Braithwaite, Nick Shortt, Allie Eathorne, Alex Semprini and Richard Beasley
Abstract
An independent online Public Health survey regarding the COVID-19 pandemic was conducted during an Alert Level 4 lockdown, the highest possible, in New Zealand. An illustrated and curiosity-driven public engagement campaign was designed to advertise survey participation, and performance compared with a standard approach using randomised controlled A/B Split tests. The ‘Caretoon’ approach featured comic illustrations, appealed to goodwill, and was intended to pique curiosity. This linked to an illustrated version of the survey which, upon completion, gave a personalised comic summary showing how respondent’s answers compared with national averages. The standard ad and survey format did not provide a personalised comic summary on completion. Both approaches were cost and time-effective, together resulting in 18,788 responses over six days. The Caretoon approach outperformed the standard approach in terms of the number of people reached, engaged, survey link clicks, gender and ethnic diversity amongst respondents, and cost-effectiveness of advertising. This came at the expense of a small reduction in the proportion of completed surveys and male respondents. The research evidences objective value of public engagement activity, comics, and curiosity as tools which can support Public Health research on a national scale.
Keywords
Graphic Medicine, Comics, Public engagement, Public Health, Social Media
Introduction
The New Zealand (NZ) government implemented an Alert Level 4 lockdown in March 2020 to control the spreading COVID-19 pandemic. A state of national emergency was declared and New Zealanders were asked to self-isolate at home. All educational facilities, public venues and business barring essential services were closed, travel was severely limited, gatherings were banned and all individuals other than those working for essential services were instructed to stay at home unless buying groceries, for local exercise or seeking medical help.(1) There were major movement restrictions at an individual level and the NZ public health message reinforced the concept of ‘staying in one’s “bubble”’.
The authors conducted an independent nationwide survey with the NZ public during the lockdown to gather demographic and behavioural information about the “bubbles” people were living in, and their adherence to public health guidance. In order to facilitate this research a public engagement strategy was designed informed by research on comics, visual communication, and online survey conduct. This paper reports a sub-study evaluating this ‘Caretoon’ strategy’s performance compared to a ‘standard’ approach to conducting online surveys. The primary observational study which reports the survey responses is to be published separately.(2)
Why does engagement matter?
‘Public engagement’ describes activities promoting a reciprocal relationship between scientists and the public they serve. This has the potential to improve research by informing study questions that address societal needs, guiding practical and acceptable study design, supporting recruitment of difficult-to-reach populations, disseminating knowledge, and the translation of results into practice.(3–8) Key research funding bodies such as the Wellcome Trust in the United Kingdom and Royal Society in NZ recognise the merit of public engagement throughout the design, conduct, and dissemination of research.(9,10) Despite much advocacy in recent years, few studies have attempted to determine the value of public engagement efforts with objective data, or controlled comparison to standard approaches. We took the opportunity of a national-scale public survey to evaluate and compare an engaging approach (Caretoon) with a standard one.
Mitigating survey fatigue
‘Survey fatigue’ is the phenomena of survey respondents providing less thoughtful answers, skipping questions, or quitting a survey before completion.(11) It is a common and important problem in survey-based research which lowers the quality of the data obtained, and can result in selection biases towards those with disproportionate views or interest in a topic. Factors which contribute to survey fatigue include survey length, topic, question complexity and type, language barriers, and health literacy.(11–13) Factors which can improve survey response rates include shorter surveys, financial incentives, prenotification, follow-up, and a study being sponsored by a university.(14,15)
Many social media platforms have features to conduct public polls which, after a respondent votes, show the results of all responses. This allows people to see how their answer(s) sit within the collective narrative of others. Some online survey tools offer a similar feature to view ones submitted responses against anonymous aggregate data from other surveys.(16,17). The authors hypothesised that advertising a survey in a way which piqued people’s curiosity to see how others responses compared to their own might act as an incentive to, and reward for taking part. As such, this might improve engagement, participation, and facilitate organic or viral link sharing.
A caretoon approach
Further consideration into how the experience of a survey participant could be improved led the authors to ‘Graphic Medicine’ - the intersection of comics and healthcare.(18). Comics have been a popular medium for exploring COVID-19-related topics, helping rapidly bring public health terminology like ‘social distancing’ into common parlance and understanding. Notable NZ examples include the comic collaborations of artist Toby Morris and microbiologist Siouxsie Wiles, which have featured in the Spinoff News throughout the pandemic, and were well-received when used by the NZ Prime Minister Jacinda Ardern during a key public address.(19–21). A recent small-scale qualitative study of patients with asthma which recruited via Facebook using an animated comic was highly engaging with the NZ public. This was a cost effective and time efficient campaign which additionally well-represented Māori, the indigenous people of NZ.(22) As a group which continues to experience significant health inequities and barriers to healthcare access; it is of particular importance for researchers in NZ to consider approaches which can support Māori.
Illustrations can support text-based content by making it easier to understand, remember, and more enjoyable to engage with.(23) In the field of healthcare, illustrating patient resources with pictures including cartoons and comics has been shown to enhance patient understanding, particularly for those with communication barriers related to education, literacy, health literacy, language and culture.(24–29) The authors therefore decided to illustrate the Caretoon survey questions and advertisement with cartoons in order to potentially improve the participants’ experience, and avail of the benefits this medium may offer.
The field of Graphic Medicine is undergoing an exciting period of evolution, but is still in a relative academic infancy.(18) While many fascinating healthcare applications of comics have been published with encouraging results, much of the literature does not report objective measures of value, has been underpowered, or was not designed to determine the significance of observed differences. The addition of randomised controlled large-scale studies are important to confirm preliminary findings, inform practice and advance the field. The ‘Caretoon’ approach featured cartoon illustrations, appealed to goodwill, and was intended to pique and reward respondent’s curiosity with a personalised comic upon completion which showed how their responses compared to the national averages. The authors hypothesised that this would improve engagement with the main observational study survey over a standard approach. This sub-study was designed in order to test that hypothesis, and advance Graphic Medicine literature with a large-scale randomised controlled study which reported objective measures of engagement.
Methods
Survey design
The authors conducted an online survey to facilitate widespread distribution under lockdown, allow for rapid analysis, and to minimise human errors. The survey was built using REDCap, a secure web platform for building and managing databases and surveys.(30) Two versions were created to compare strategies; a standard text-only survey, and an illustrated survey for the Caretoon approach. The latter featured identical questions illustrated with relevant cartoons, and presented a personalised comic upon completion which showed how a respondent’s answers compared to the anonymous averages for responses submitted thus far (Figure 1). Personalisation included both dynamically generated text (based on data provided by the respondent and the database of responses), and art (from a series of illustrations to represent average bubble sizes for the respondent and ‘average Kiwi’ as per Figure 2). The standard survey did not present a personalised comic summary on completion.
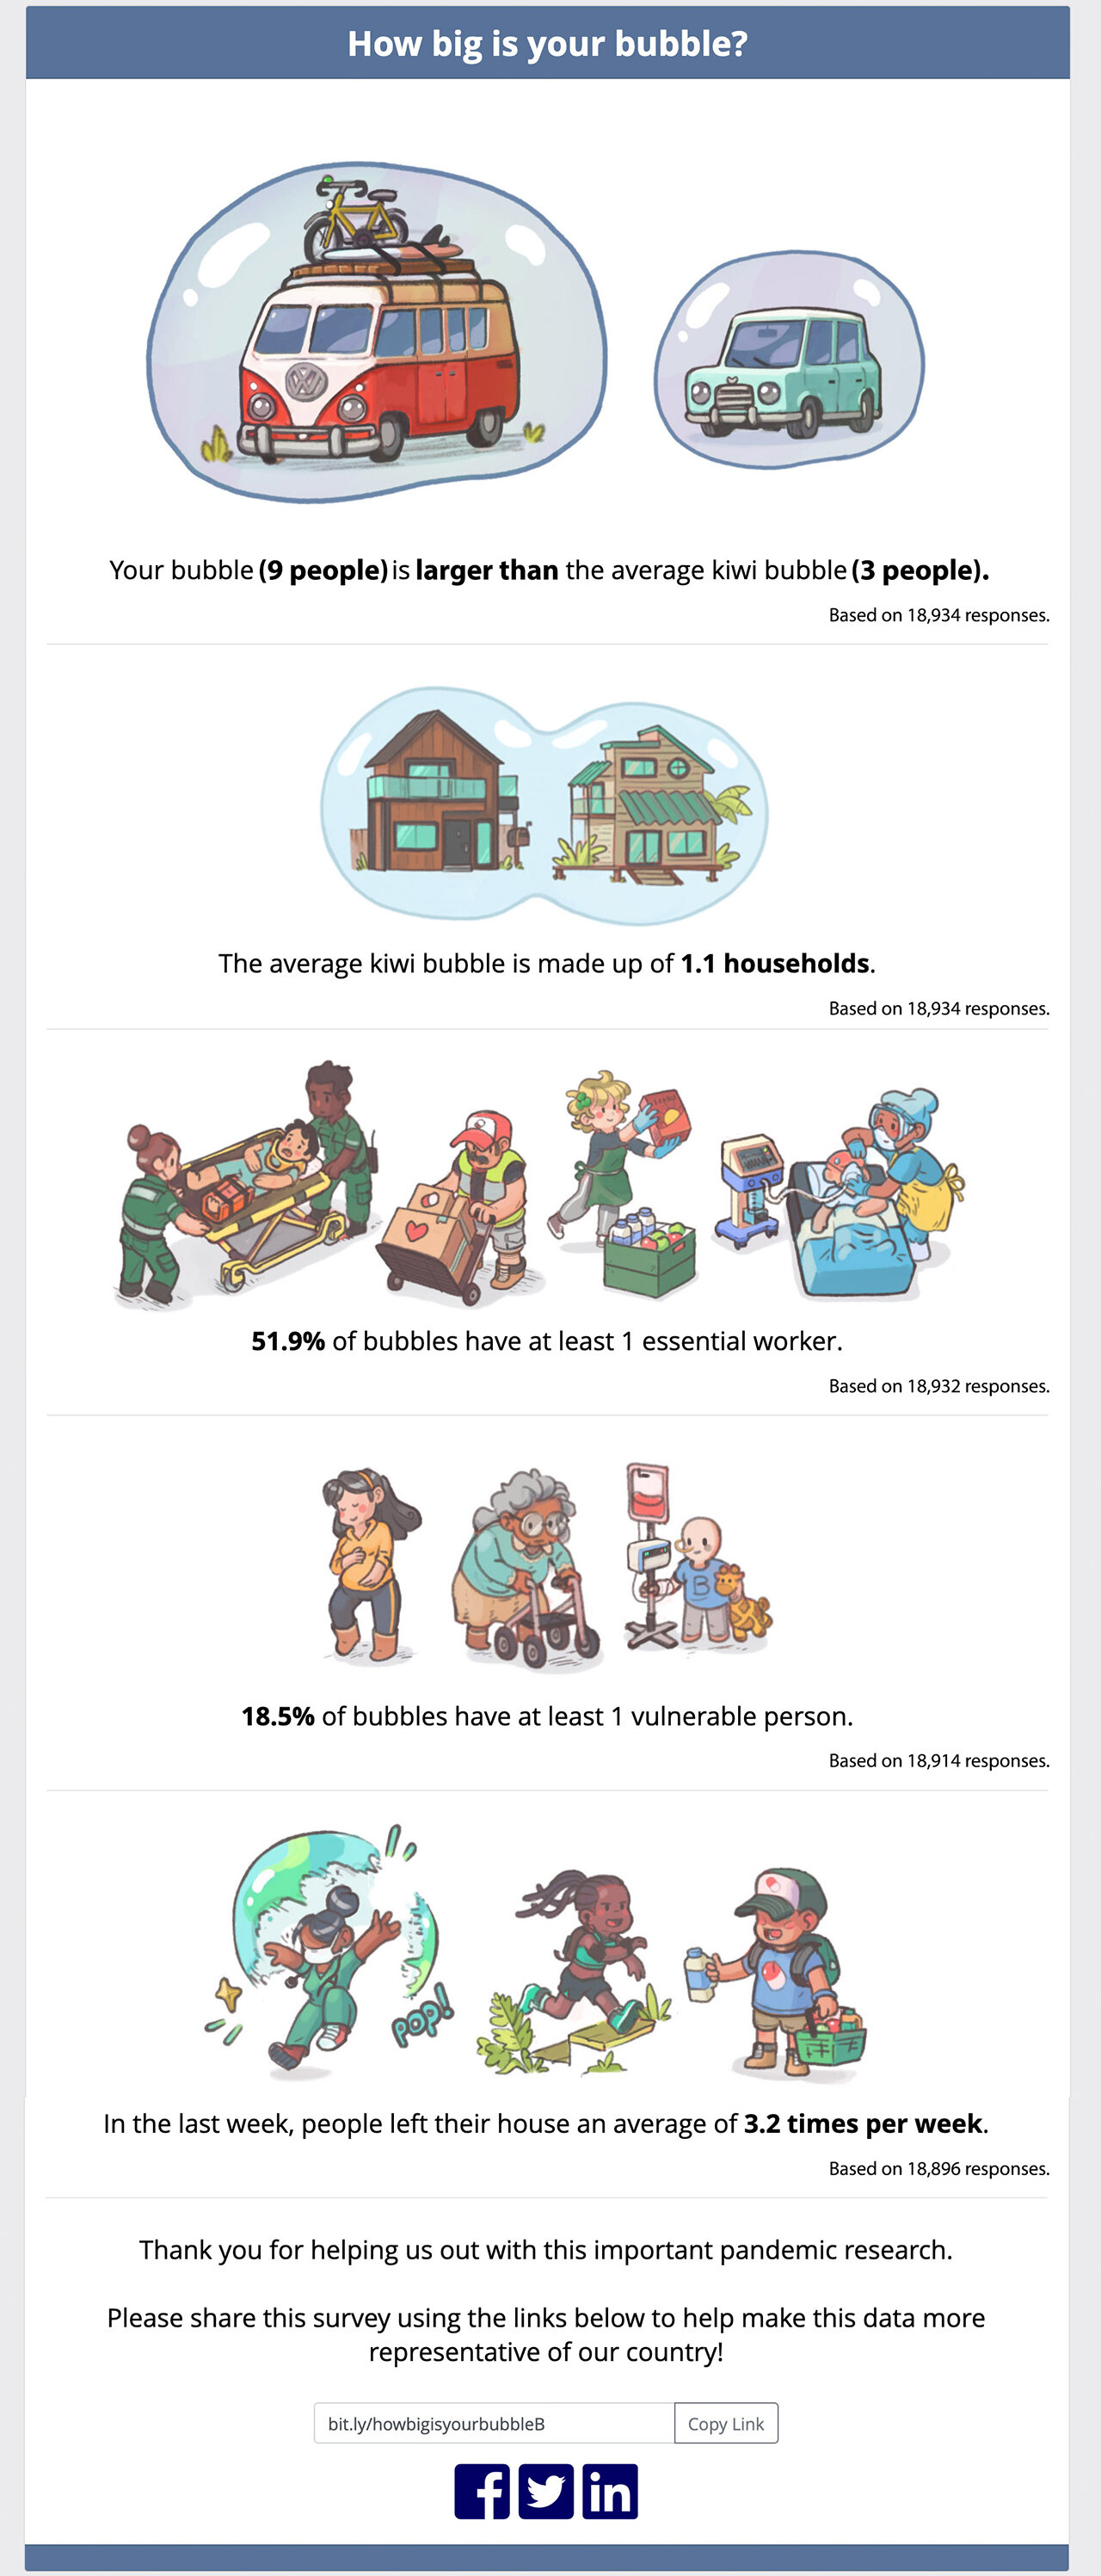
Figure 1. The personalised comic presented at the end of the Caretoon survey which showed how a respondent’s answers compare to the Kiwi average, based on the surveys submitted thus far.

Figure 2. Breakdown of a panel in the personalised comic presented at the end of the Caretoon survey. This adapted to each respondent by drawing art from a series of illustrations based on the respondent’s answers, and the database of survey responses submitted so far. This showed respondents how their answers fit in a national context.
Illustrations
A cast of characters were designed to illustrate the Caretoon survey questions reflecting the diversity of New Zealanders (Figure 3). Kiwi-specific visuals were used to show local relevance and inspire community spirit. This included a character tramping (NZ term for hiking), a globe centred on Australasia, an Auckland skyline and kiwi birds (Figures 3 and 4). These cartoons supported questions with specific visual examples (e.g. exercising outdoors) and conceptual representation of ideas posed in the questions (e.g. the visual metaphor of a house in a bubble, or characters leaving a bubble for essential work (Figure 3).

Figure 3. Characters who illustrated questions in the Caretoon survey. The upper row shows examples of essential work roles, the middle row shows examples of people classed as vulnerable, and the lower row shows some Government-approved reasons a person might leave their lockdown bubble. Note the visual metaphor used to represent ‘leaving the bubble’ on the bottom left, making this abstract concept more tangible.
Survey distribution & Data Analysis plan
The 2018 New Zealand Census reported 3.78 million people aged 15 years or older living in New Zealand.(31) In March 2020, Facebook’s Marketing application program interface reported 3.48 million Facebook users in New Zealand in this age bracket, which is potentially up to 92% of the New Zealand population at this time.(32) As the study was intended for those 16 years and above, distribution of the survey via Facebook offered the potential to reach most of the population of interest.
A/B (also known as split tests) are a user experience research methodology where users are shown one of a number of variations of content at random. User interactions can be statistically analysed to determine which content variation performs better for a given goal, such as link clicks. The standard and Caretoon ads were shared on Facebook via an A/B test with 50:50 randomisation over 72 hours. A second A/B test with 50:50 randomisation was conducted via MailChimp; this sent one of two emails (advertising either the standard or Caretoon survey), to the research institutes mailing list of approximately 2000 people. Upon submission of a survey, participants were encouraged to share a provided link to access a blank survey of the same kind they had just completed (standard or Caretoon).
Performance of the ads was measured using engagement metrics available from Facebook and MailChimp. Social media engagement is a measure of the number of times users interact with content, in the ways available on the platform such as ‘likes’, ‘comments’, ‘shares’, and ‘link clicks’. Survey completion rates and respondent demographics were available from REDCap for all submitted surveys. Differences observed between the standard and Caretoon survey approaches were assessed for statistical significance with Chi-squared tests using R software.
The standard survey was shared using an illustration of the research institute’s logo and text encouraging participation to support pandemic research appealing to goodwill (Figure 4, left image). The Caretoon survey featured a single-panel comic illustration and text encouraging respondents to take part and see how their bubble compared with the rest of the country while supporting pandemic research, intended to appeal to both curiosity and goodwill (Figure 4, right illustration). The characters shown included simplified blue human characters and cute kiwi birds (with Kiwi being an endearing term for all New Zealanders). By not overly-specifying demographics in these designs, and by using the national icon of the kiwi, it was hoped that viewers could project their identity, or ‘see themselves’ in the scene. A cute kaiju (strange beast) was drawn in the cityscape wearing a face mask and fetching their shopping as a humorous eye-catching element. Humour has been shown to be able to attract attention when advertising health messages, and can make the presentation of potentially negative information less unpleasant.(33) Given the uncertainty of New Zealand’s future at the time of survey conduct regarding the accelerating global impact of COVID-19, it was important to present the survey as something positive viewers could contribute to.
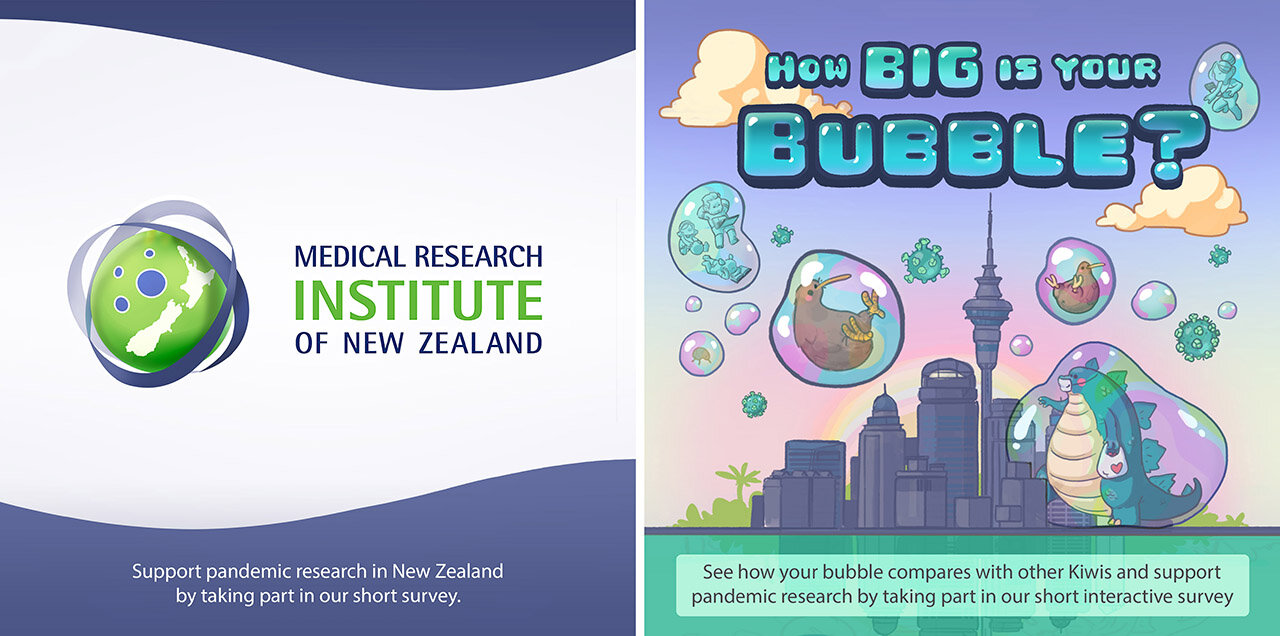
Figure 4. Visuals used to advertise the standard (left) and Caretoon (right) surveys on Facebook. The standard survey graphic included a message appealing to goodwill to encourage participation; the single-panel comic for the Caretoon survey ad appealed to both curiosity and goodwill.
Results
Survey Advertising
The differences in engagement between the standard and Caretoon survey ads on Facebook were significant (p<0.01) for each age category shown in Table 1. An older demographic engaged with the standard survey ad, peaking in the 55-64 age category, compared to engagement with the Caretoon survey ad which peaked in the 25-34 years age category. Engagement and link click rates with men were 45.9% greater (p<0.01) for those viewing the Caretoon ad, compared to the standard ad. Differences between other groups were not significant.

Table 1. Performance metrics for the A/B split test ads.
Survey completion data and demographics
Data was collected over six days, resulting in 18,788 responses from all regions of New Zealand for under NZ$500 in Facebook ad spend. A survey was deemed completed if all questions considered essential for analysis of bubble demographics had been completed. 7696 (80.8%) of respondents to the standard survey completed all questions, compared to 7180 (77.5%) of respondents to the Caretoon survey (3.3% fewer, p<0.01). 31.2% of standard survey respondents signed up for further contact, compared to 27.7% for the Caretoon survey (3.82% fewer, p<0.01). Organic (uncontrolled) sharing of the ad materials by social media and email was possible with both platforms and is reflected in the differences between ad clicks and final survey counts received. Respondent demographics for completed surveys are broken down in Table 2.
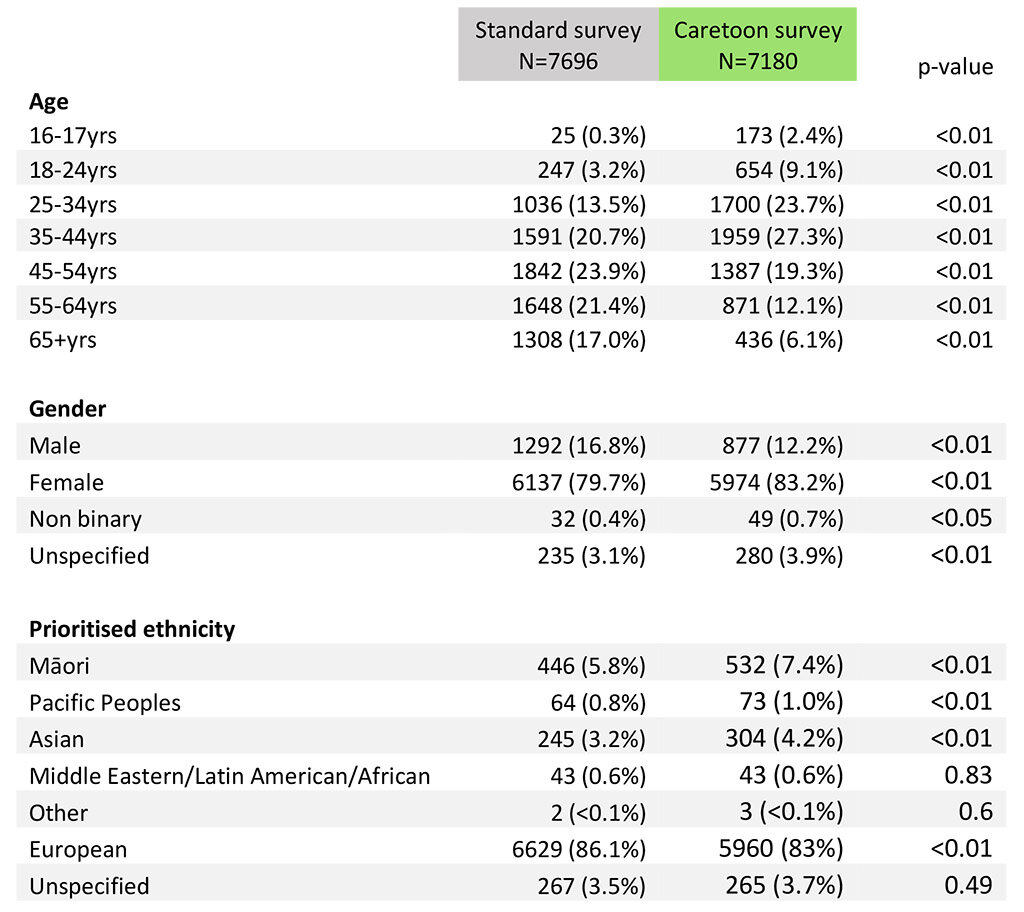
Similar to the age distribution of those engaging with the Facebook ads shown in Table 1, Table 2 shows that the Caretoon survey respondents reflected a younger age demographic (mean (SD) 41(13.8) excluding a single impossible outlier) than the standard survey (mean (SD) 49(14.2)). The differences in proportions of respondents in each gender category between the standard and Caretoon survey were all significant at p<0.01. The prioritised ethnicity of respondents presented in Table 2 is a reduction process used in New Zealand for analysis which allocates respondents with multiple ethnicities to a single ethnic group. This allows ethnic groups of policy importance or small size not to be swamped by the NZ European group.(34)
Discussion
Facebook A/B test
On Facebook, the Caretoon ad approach resulted in 20.3% greater ad reach, 27.0% greater engagement, and 26.2% more link clicks to view the survey, per dollar spent. This evidences our hypothesis that appealing to curiosity and using comics can be an effective approach to survey advertising. There was also a significant difference in engagement rates favouring the Caretoon approach (9.31%, compared to the standard ad at 8.83%, p<0.05). The average engagement with both ads was over tenfold greater (at over 8.8% for both survey ads) than industry averages for the Healthcare sector (0.83%) based on data published in 2020 by WordStream.(35) The cost per click (CPC) for our ads was approximately 13x less expensive (standard survey ad) and 16x less expensive (Caretoon survey ad) than the average for the Healthcare sector reported in the same data set. While this may indicate two particularly engaging ads and the institute’s experience with online recruitment and public engagement, the authors suspect interest in COVID-19 may have interfered.
Mailchimp A/B test
Advertising the survey via the research institute’s mailing list using MailChimp resulted in a significant difference in the proportion of emails opened favouring the Caretoon approach. About one in every three people clicked the survey link - over triple the click-through rate of a general public audience viewing the ad on Facebook (Table 1). This is expected given email recipients having an existing relationship with sender, in our case from having joined the list through past expressions of interest or participation in research. However, the mailing list engagement also outperformed averages for the Healthcare industry by almost threefold for the open rate, and over tenfold for the click-through rate, based on big data from MailChimp for 2019.(36) This evidences reciprocal value when scientists participate in public engagement activity and build relationships with the people their research serves. The proportion of survey clicks was similar between strategies with insignificant difference.
Survey responses
Metrics from the controlled A/B split tests show which strategy was more effective at engaging people and directing them to the surveys. People could also organically share survey links independently on social media and by email. As advertising on Facebook and MailChimp resulted in 5717 survey link clicks, this is the maximum number of completed surveys these advertising methods could have been directly responsible for (as those who arrived at either survey did not necessarily complete it). More than two thirds of completed surveys were therefore the result of organic sharing, demonstrating a degree of virality from genuine public interest.
The proportion of incomplete surveys indicates the level of survey fatigue, which to our surprise was greater for the Caretoon survey. We hypothesise this small but significant difference was a result of the vertical space images occupied, requiring respondents to scroll further on each page of the survey in order to progress. While increased survey length is known to increase survey fatigue, past literature has typically referred to the number of questions and length of text, rather than vertical space occupied by visuals.(11)
Over a quarter of respondents to both surveys signed up to the institute’s mailing list (for contact about this and further studies), leading to significant growth from a single study. The high survey click-through rates from the MailChimp split test evidence the value of building a mailing list through public engagement efforts. The sign-up rates suggest high levels of survey interest at the point of completion. We note this was lower for the Caretoon survey by a small but significant amount. Sign-up occurred at the point of maximum fatigue one click before survey completion. This was prior to providing the reward for a respondent’s efforts in the form of the personalised comic which had been promoted as an incentive to take part. While this position was deliberate for consistency between surveys, we hypothesise the proportion of respondents who signed up may have differed if the question had been presented after the comic summary.
Ethnicity and gender
Amongst completed surveys for both strategies, female respondents were over-represented suggesting perhaps greater responsiveness to online survey-based research. The Caretoon survey had a 61.9% greater proportion of responses from people of nonbinary gender (p=0.04), and from people of ethnic minority groups including 27.6% more Māori (p<0.01), and 33.0% more Asian respondents (p<0.01). Although there were also higher proportions of Pacific Peoples and Middle Eastern/Latin American/African respondents, this difference was not statistically significant. Although the engagement and link click rates for males were almost 50% higher for the Caretoon ad, the proportion of complete survey responses from males was around 5% fewer. This may suggest lower follow-through rates on initial indications of interest.
Culture-sensitive adaptation of patient information materials can improve their utility for minority groups.(37) Graphics are one such adaptation recommended to help overcome potential barriers of health literacy, culture and language differences.(7,38) The use of culturally and ethnically representative photographs are often used when adapting patient resources. While photos depict specific individuals, comic illustration can be widely representative by lack of overly-specifying demographic information – an extreme example of this being abstraction of the human form into stick figures.(39) Research by Hosey et al. (on the design of diabetes educational resources for American Indians), and by Dowse et al. (who evaluated pharmaceutical pictograms in a South African population with limited literacy), found that people preferred the use of simple illustrations which were culturally sensitive and orientated to the community they were designed for.(28,40,41) More ethnic and gender diversity amongst respondents to the Caretoon survey could be the result of the simplified cartoon characters and culturally relevant imagery resonating well with a diverse Kiwi audience. This idea is additionally supported by the increased level of public engagement with the Caretoon survey’s ad on Facebook. Illustration may also have made questions easier to understand, particularly amongst those with limited English language proficiency.(23) Further to the findings of Kearns et al who effectively recruited with an animated comic on social media at a local level in NZ, this research more robustly evidences the supporting role comics can play in facilitating research participation which is reflective of a populations diversity, and at a national scale.(22) Systematic reviews have highlighted factors which facilitated research participation amongst minority groups which may have been more applicable to the Caretoon approach.(42,43) These included a good provider-patient relationship (supported by public engagement activity), perceived benefit of participation (rewarding curiosity), and feelings of altruism (supporting pandemic research in New Zealand).
It is important to note that despite higher proportions of responses from some Indigenous and ethnic minority groups with the Caretoon approach, these proportions were lower than in the NZ population which reported 16.5% Māori, 15.1% Asian, and 8.1% Pacific Peoples in the 2018 Census. Therefore, while better than the standard approach in some regards, there remains room for improvement.(31) Ethnic and gender minority groups face substantial health disparities in many societies, including higher incidence of disease, mental health disorders, substance abuse, greater numbers of comorbidities, increased mortality rates, and people being more likely the victim of violence.(44–46) Communication approaches which can reach and engage people in these groups are important to facilitate research and interventions which seek to reduce these inequities.
Limitations
The surveys were only available in the English language creating a selection bias against people with limited English. By conducting online surveys the study excluded participation of those without access to the internet which was 7% of the NZ population in 2017 according to report from InternetNZ (a Charitable NGO).(47) Convenience sampling by advertising on Facebook and using a mailing list is not a statistically robust approach to population surveying, and so results cannot be assumed to be representative of the NZ population. However, systematic reviews of Facebook advertising for health research recruitment have found that this methodology can produce representative data for a population, while having additional benefits of supporting the inclusion of hard-to-reach and younger populations, with significantly reduced costs, and time spent recruiting.(48,49) Advertising via MailChimp to the research institute’s mailing list may have skewed data for up to 538 people who accessed the survey this way leading to over-representation of people with an existing relationship to the research institute. With 18,788 responses received and no opinion questions having been asked, any effect from this is expected to be minimal. As the sub-study was not designed to test whether the Caretoon approach better engaged specific respondent demographics, the significance of these observations may diminish with more complex statistical analyses controlling for the available degrees of freedom.
The novel Caretoon strategy differed from the standard approach to online survey conduct in two key ways: 1) the Caretoon advertisements and survey featured comic illustrations, and 2) upon survey completion respondents were presented with a personalised comic showing how their responses compared to others received thus far. The survey advertisement for the Caretoon strategy highlighted this second point to pique viewer interest in participating. Differences in survey engagement between the Caretoon and standard approach therefore represent the effect of both of these variations used together; the contribution of each cannot be discerned from the design of this study. It is possible that the motivation to compare ones actions to others and see if the NZ public were following quarantine guidance could have contributed more to the performance of the Caretoon strategy than the visuals used. Alternate styles of artwork may appeal better to particular demographics; it is possible that multiple strategies would need to be employed in order to facilitate truly representative respondent demographics in a national-scale population survey.
Both approaches investigated involved public engagement activity with members of the research team responding promptly to comments on social media; they also featured high-quality ad graphics, and a clear concise message appealing to public goodwill. We would expect survey advertising without these elements to perform worse regardless of the type of survey used.
Finally, it is worth noting that comics are simply a medium of communication; their content, presentation, and audience factors will determine their effectiveness in healthcare research settings. The authors recommend collaboration between subject matter experts, artists, and members of the intended audience to design effective comics that best communicate the intended messages.
Future research
The authors propose the term ‘survey intrigue’ to describe considerations which improve a participant’s experience of taking part in survey-based research. This is in contrast to making surveys more tolerable, as is often the framing when discussing survey fatigue. This paper presents evidence supporting curiosity and comic illustration as factors which may support survey intrigue. Given the localisation of the artwork to a New Zealand audience and global interest in COVID-19, it would be useful to replicate a similar comparison of approaches for other healthcare topics in other countries to confirm whether this is effective in other settings.
Conclusion
Both campaigns were highly successful in reaching and engaging the NZ population in Public Health research in a time and cost-effective manner, during a highly restrictive national lockdown for COVID-19. Our results demonstrate that an approach featuring comic illustrations which piqued and rewarded curiosity outperformed a standard approach to survey-based research in terms of people reached, public engagement, gender and ethnic diversity amongst respondents, and cost effectiveness of advertising. This came at the expense of a small reduction in the proportion of completed surveys, mailing list sign-ups, and the proportion of male responses. The Caretoon strategy better engaged a younger audience of adult New Zealanders, and the standard survey better engaged an older audience of adult New Zealanders. This paper provides objective evidence of the value of public engagement activity, comic illustration, and appealing to curiosity as tools which can support healthcare research on a national scale.
Acknowledgements
The authors wish to acknowledge Professor Mark Weatherall for advice on statistical analysis for this paper, and the New Zealand public who kindly gave their time to make this research and its parent study possible.
Declaration of conflicts of interest
RB reports grants from Health Research Council of New Zealand. The authors declare no competing interests.
Funding
The Medical Research Institute of New Zealand receives Independent Research Organisation funding from the Health Research Council of New Zealand (IRO grant [18/002]).
References
1. New Zealand Government. What you need to know. [Internet]. Unite Against COVID-19. [cited 2020 May 13]. Available from: https://covid19.govt.nz/
2. Braithwaite I, Shortt N, Kearns C, Eathorne A, Holliday M, Kearns N, et al. How big is your bubble? - Characteristics of self-isolating household units (“bubbles”) during the COVID-19 Alert Level 4 period in New Zealand: a Survey. Unpublished. 2020;
3. Alamri A, Rogers P, Kearns C, Doke T, Al-Habib A, Servadei F, et al. Social media for dissemination and public engagement in neurosurgery-the example of Brainbook. Acta Neurochir (Wien). 2019 Jan;161(1):5–9.
4. Banner D, Bains M, Carroll S, Kandola DK, Rolfe DE, Wong C, et al. Patient and Public Engagement in Integrated Knowledge Translation Research: Are we there yet? Res Involv Engagem [Internet]. 2019 Dec [cited 2019 Dec 2];5(1). Available from: https://researchinvolvement.biomedcentral.com/articles/10.1186/s40900-019-0139-1
5. Elsabbagh M, Yusuf A, Prasanna S, Shikako-Thomas K, Ruff CA, Fehlings MG. Community engagement and knowledge translation: Progress and challenge in autism research. Autism. 2014 Oct;18(7):771–81.
6. Holzer JK, Ellis L, Merritt MW. Why We Need Community Engagement in Medical Research: J Investig Med. 2014 Aug;62(6):851–5.
7. UyBico SJ, Pavel S, Gross CP. Recruiting Vulnerable Populations into Research: A Systematic Review of Recruitment Interventions. J Gen Intern Med. 2007 May 10;22(6):852–63.
8. Morris ZS, Wooding S, Grant J. The answer is 17 years, what is the question: understanding time lags in translational research. J R Soc Med. 2011 Dec;104(12):510–20.
9. Wellcome Trust. Public engagement support for researchers [Internet]. Available from: https://wellcome.ac.uk/what-we-do/our-work/public-engagement-support-researchers
10. Royal Society of New Zealand. Public engagement guidelines for researchers, scholars and scientists [Internet]. 2016. Available from: https://www.royalsociety.org.nz/what-we-do/research-practice/public-engagement-guidelines/public-engagement-guidelines-for-researchers-scholars-and-scientists/
11. Pazit B-N. Respondent fatigue. In: Encyclopedia of survey research methods 2. 2008. p. 742–3.
12. O’Reilly-Shah VN. Factors influencing healthcare provider respondent fatigue answering a globally administered in-app survey. PeerJ. 2017;5:e3785.
13. Wohlfahrt P, Zickmund SL, Slager S, Allen LA, Nicolau JN, Kfoury AG, et al. Provider Perspectives on the Feasibility and Utility of Routine Patient-Reported Outcomes Assessment in Heart Failure: A Qualitative Analysis. J Am Heart Assoc. 2020 Jan 21;9(2):e013047.
14. Kellerman S. Physician response to surveys A review of the literature. Am J Prev Med. 2001 Jan;20(1):61–7.
15. Ladik DM, Carrillat FA, Solomon PJ. The Effectiveness of University Sponsorship in Increasing Survey Response Rate. J Mark Theory Pract. 2007 Jul;15(3):263–71.
16. Qualtrics. Displaying Live Results [Internet]. Qualtrics. [cited 2020 Apr 28]. Available from: https://www.qualtrics.com/support/survey-platform/common-use-cases-rc/displaying-live-results/
17. View & analyze survey responses in real time. [Internet]. SurveyMonkey. [cited 2020 Apr 28]. Available from: https://help.surveymonkey.com/articles/en_US/kb/What-are-Instant-Results#Respondents
18. Green MJ, Myers KR. Graphic medicine: use of comics in medical education and patient care. BMJ. 2010 Mar 29;340(mar03 2):c863–c863.
19. Kearns C, Kearns N. The role of comics in public health communication during the COVID-19 pandemic. J Vis Commun Med. 2020 Jul 9;1–11.
20. Wiles S. The three phases of Covid-19 - and how we can make it manageable. The Spinoff [Internet]. 2020 Mar 9 [cited 2020 Mar 25]; Available from: https://thespinoff.co.nz/society/09-03-2020/the-three-phases-of-covid-19-and-how-we-can-make-it-manageable/
21. Manhire T. Covid-19: All arrivals to NZ must self-isolate for 14 days. Here’s what you need to know. The Spinoff [Internet]. 2020 Mar 14 [cited 2020 May 4]; Available from: https://thespinoff.co.nz/politics/14-03-2020/covid-19-christchurch-service-cancelled-as-nz-confirms-sixth-case-what-we-know-so-far/
22. Kearns C, Baggott C, Harwood M, Alice R, Fingleton J, Levack W, et al. Engaging Māori with qualitative healthcare research using an animated comic. Unpubl Rev. 2020;
23. Howard Levie W, Lentz R. Effects of text illustrations: A review of research. Educ Technol Res Dev. 1982;30(December):195–232.
24. Delp C, Jones J. Communicating Information to Patients: The Use of Cartoon Illustrations to Improve Comprehension of Instructions. Acad Emerg Med. 1996 Mar;3(3):264–70.
25. Austin PE, Matlack∥‡ R, Dunn KA, Kesler C, Brown CK. Discharge Instructions: Do Illustrations Help Our Patients Understand Them? Ann Emerg Med. 1995 Mar;25(3):317–20.
26. Brotherstone H, Miles A, Robb KA, Atkin W, Wardle J. The impact of illustrations on public understanding of the aim of cancer screening. Patient Educ Couns. 2006 Nov;63(3):328–35.
27. Murphy DA, Hoffman D, Seage GR, Belzer M, Xu J, Durako SJ, et al. Improving comprehension for HIV vaccine trial information among adolescents at risk of HIV. AIDS Care. 2007 Jan;19(1):42–51.
28. Houts PS, Doak CC, Doak LG, Loscalzo MJ. The role of pictures in improving health communication: A review of research on attention, comprehension, recall, and adherence. Patient Educ Couns. 2006 May;61(2):173–90.
29. Tjiam AM, Holtslag G, Van Minderhout HM, Simonsz-Tóth B, Vermeulen-Jong MHL, Borsboom GJJM, et al. Randomised comparison of three tools for improving compliance with occlusion therapy: an educational cartoon story, a reward calendar, and an information leaflet for parents. Graefes Arch Clin Exp Ophthalmol Albrecht Von Graefes Arch Klin Exp Ophthalmol. 2013 Jan;251(1):321–9.
30. Harris PA, Taylor R, Thielke R, Payne J, Gonzalez N, Conde JG. Research electronic data capture (REDCap)—A metadata-driven methodology and workflow process for providing translational research informatics support. J Biomed Inform. 2009 Apr;42(2):377–81.
31. New Zealand 2018 Census. [Internet]. Stats NZ Tatauranga Aotearoa. 2018 [cited 2020 Apr 28]. Available from: https://www.stats.govt.nz/tools/2018-census-place-summaries/
32. Facebook users in New Zealand [Internet]. NapoleonCat. 2020 [cited 2020 Apr 28]. Available from: https://napoleoncat.com/stats/facebook-users-in-new_zealand/2020/03
33. Blanc N, Brigaud E. Humor in Print Health Advertisements: Enhanced Attention, Privileged Recognition, and Persuasiveness of Preventive Messages. Health Commun. 2014 Aug 9;29(7):669–77.
34. Health Information Standards Organisation Paerewa Pārongo Hauora. HISO 10001:2017 Ethnicity Data Protocols [Internet]. Ministry of Health Manatū Hauora; 2017 [cited 2020 May 13]. Available from: https://www.health.govt.nz/system/files/documents/publications/hiso-10001-2017-ethnicity-data-protocols-v2.pdf
35. Irvine M. Facebook Ad Benchmarks for YOUR Industry [Data] [Internet]. WordStream. 2020 [cited 2020 Apr 29]. Available from: https://www.wordstream.com/blog/ws/2017/02/28/facebook-advertising-benchmarks
36. Email Marketing Benchmarks by Industry [Internet]. MailChimp. 2019 [cited 2020 Apr 29]. Available from: https://mailchimp.com/resources/email-marketing-benchmarks/
37. Hölzel LP, Ries Z, Kriston L, Dirmaier J, Zill JM, Rummel-Kluge C, et al. Effects of culture-sensitive adaptation of patient information material on usefulness in migrants: a multicentre, blinded randomised controlled trial. BMJ Open. 2016 23;6(11):e012008.
38. Andrulis DP, Brach C. Integrating literacy, culture, and language to improve health care quality for diverse populations. Am J Health Behav. 2007 Oct;31 Suppl 1:S122-133.
39. McCloud S. Understanding comics. Reprint. New York: William Morrow, an imprint of Harper Collins Publishers; 2017. 215 p.
40. Hosey GM, Freeman WL, Stracqualursi F, Gohdes D. Designing and Evaluating Diabetes Education Material for American Indians. Diabetes Educ. 1990 Oct;16(5):407–14.
41. Dowse R, Ehlers MS. The evaluation of pharmaceutical pictograms in a low-literate South African population. Patient Educ Couns. 2001 Nov;45(2):87–99.
42. George S, Duran N, Norris K. A systematic review of barriers and facilitators to minority research participation among African Americans, Latinos, Asian Americans, and Pacific Islanders. Am J Public Health. 2014 Feb;104(2):e16-31.
43. Schmotzer GL. Barriers and facilitators to participation of minorities in clinical trials. Ethn Dis. 2012;22(2):226–30.
44. Davidson E, Sheikh A. Tackling ethnic variations in asthma outcomes in New Zealand’s Mãori and Pacific children will need a long-term strategy. Prim Care Respir J J Gen Pract Airw Group. 2013 Sep;22(3):269–70.
45. Health Quality & Safety Commission New Zealand. Atlas of Healthcare Variation: Asthma [Internet]. 2016 [cited 2020 Feb 4]. Available from: https://www.hqsc.govt.nz/our-programmes/health-quality-evaluation/projects/atlas-of-healthcare-variation/asthma/
46. Reisner SL, Poteat T, Keatley J, Cabral M, Mothopeng T, Dunham E, et al. Global health burden and needs of transgender populations: a review. Lancet Lond Engl. 2016 Jul 23;388(10042):412–36.
47. InternetNZ. State of the Internet 2017: the state of the internet in New Zealand [Internet]. 2017 [cited 2020 May 13]. Available from: https://internetnz.nz/sites/default/files/SOTI%20FINAL.pdf
48. Whitaker C, Stevelink S, Fear N. The Use of Facebook in Recruiting Participants for Health Research Purposes: A Systematic Review. J Med Internet Res. 2017 Aug 28;19(8):e290.
49. Thornton L, Batterham PJ, Fassnacht DB, Kay-Lambkin F, Calear AL, Hunt S. Recruiting for health, medical or psychosocial research using Facebook: Systematic review. Internet Interv. 2016 May;4:72–81.